![]()
An animated chart library for flutter. - Support for datetime axis - Multiple y axis, supporting different units - Highlight selection - Animation of the chart - Tested with more than 3000 points and still performing
There are currently two different charts: - line chart - area chart
Getting Started
Try the sample project or include in your project.
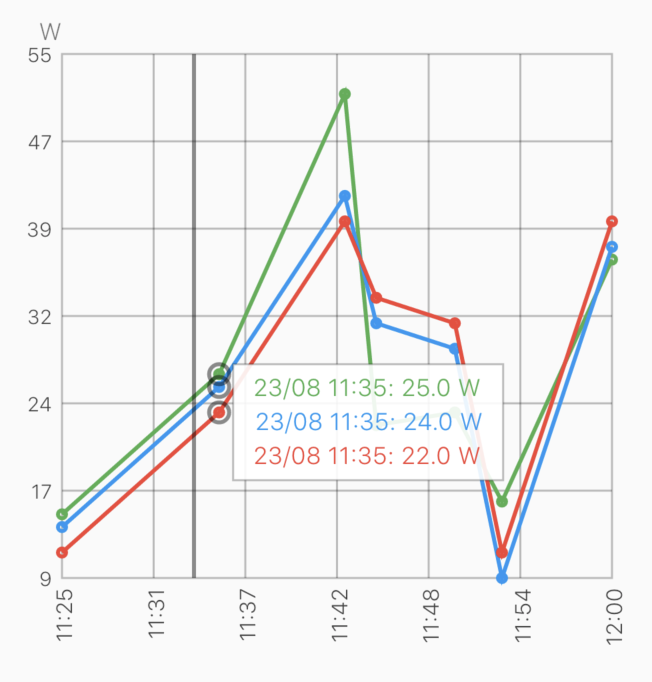
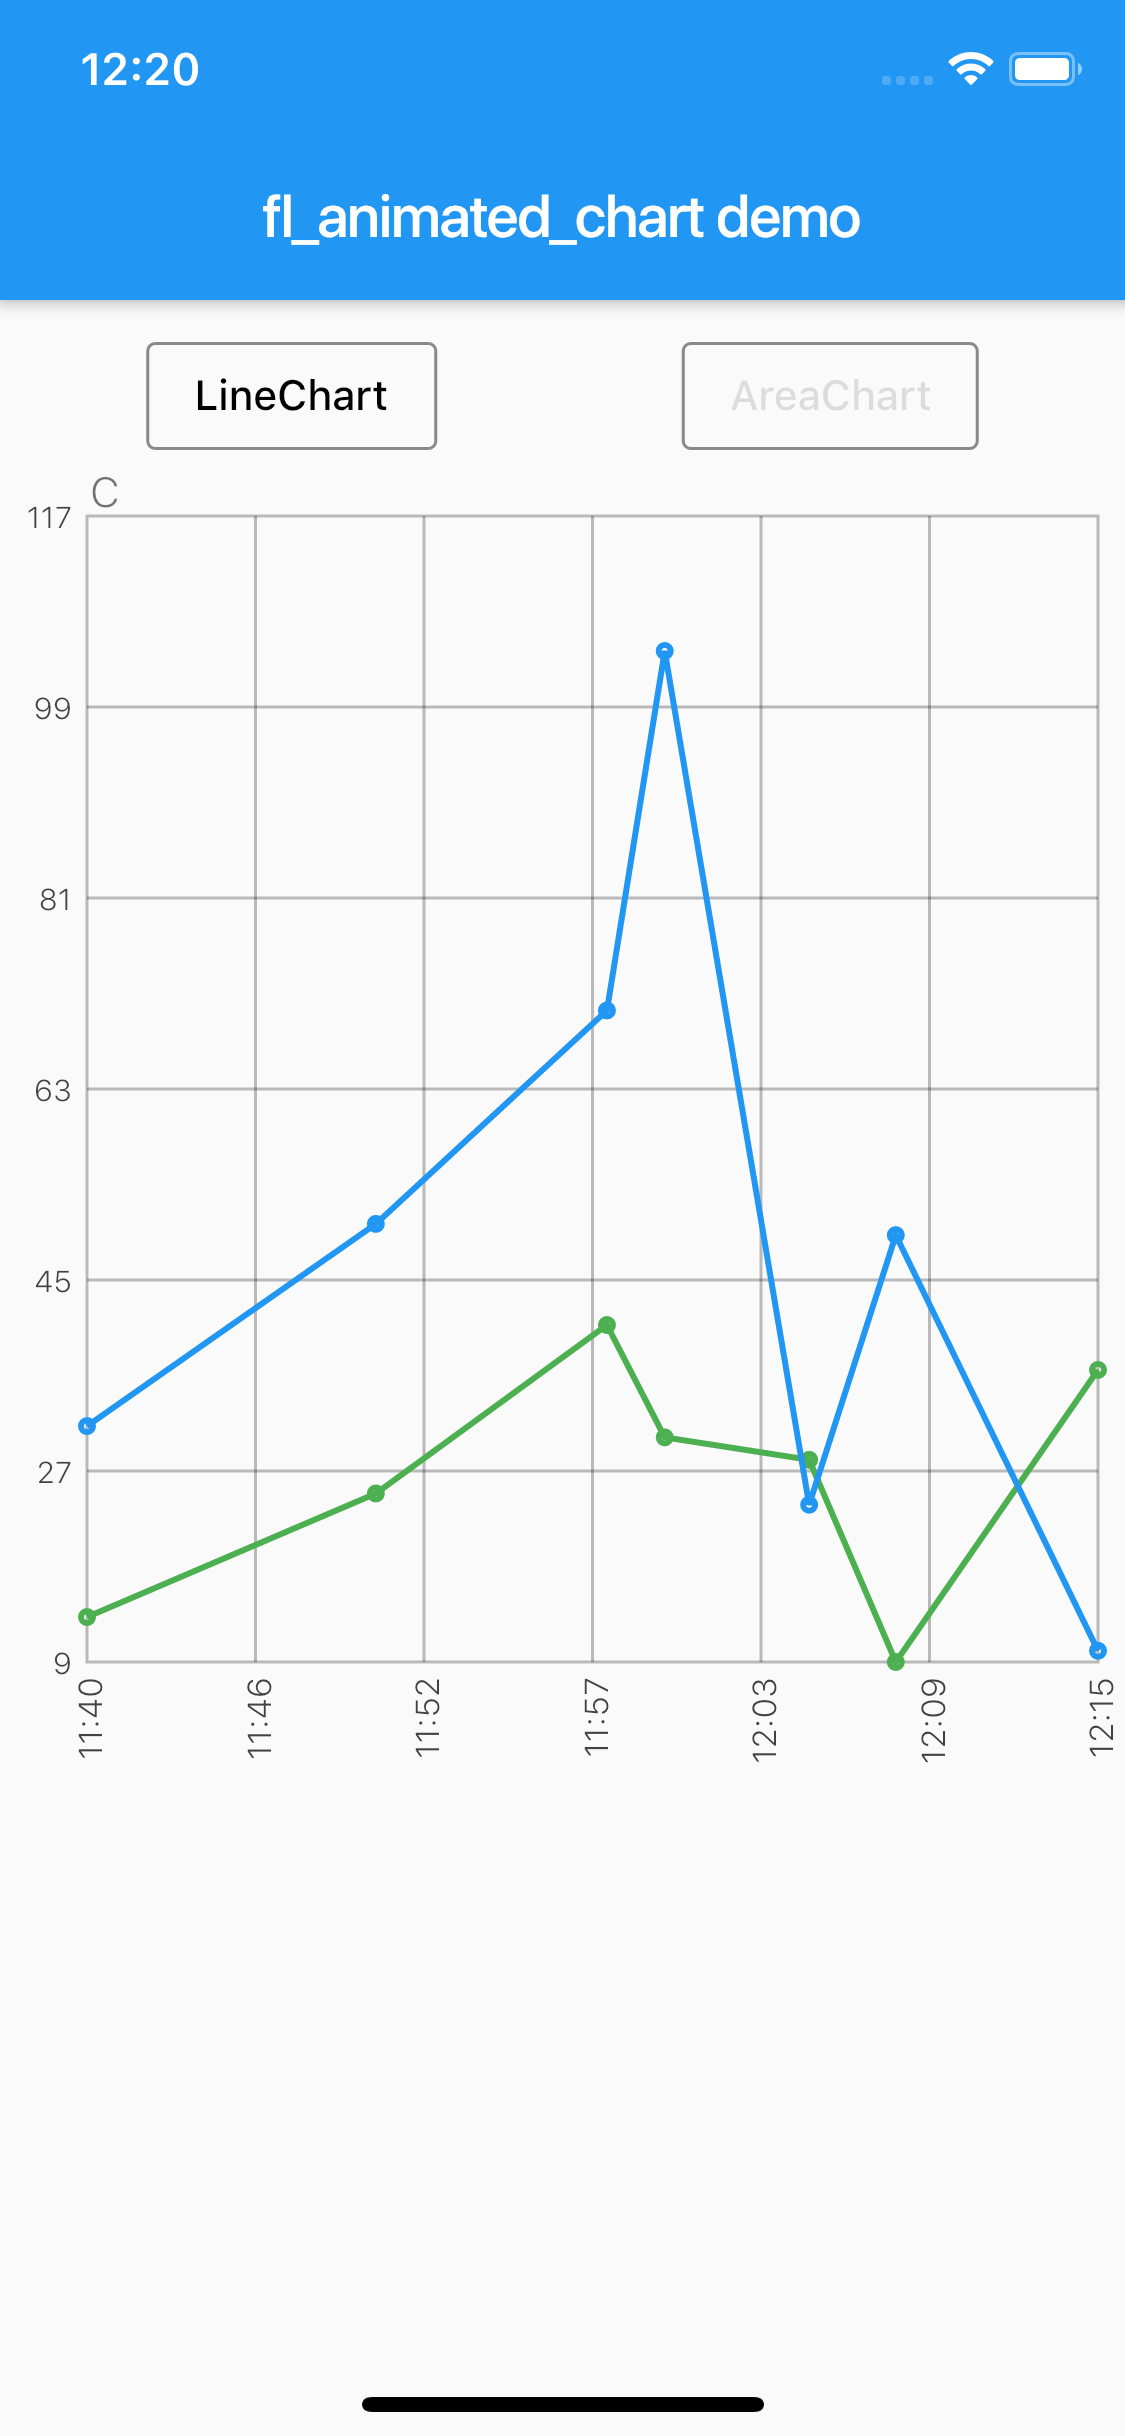
Highlight for the line chart:
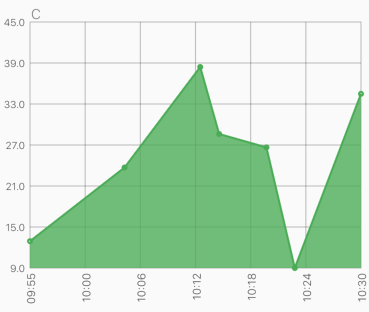
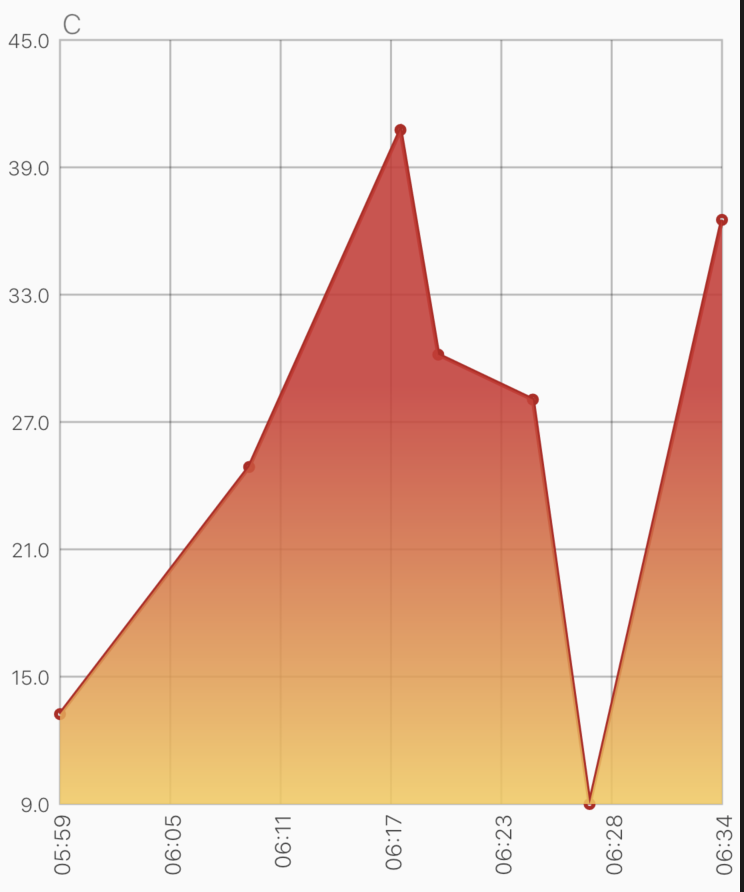
Area chart:
Example code:
LineChart lineChart = LineChart.fromDateTimeMaps([line1, line2], [Colors.green, Colors.blue]);

return Scaffold(
  appBar: AppBar(
    title: Text(widget.title),
  ),
  body: Container(
    child: Column(
        mainAxisSize: MainAxisSize.max,
        mainAxisAlignment: MainAxisAlignment.spaceBetween,
        crossAxisAlignment: CrossAxisAlignment.stretch,
        children: [
          Expanded(child: AnimatedLineChart(lineChart)),
        ]
    ),
  ),
);
The example app, can toggle between line chart and area chart.
SHARE: